Airports are the unsung establishments in an ever-evolving globalized world we all share a bitter-sweet relationship. Lost baggage, delayed flights, transit recreation, and accommodating or unaccommodating staff make up a huge chunk of every passenger’s experience around the globe.
Cabin Crew HQ has curated a list of the best airports based on fewest delays, most economical parking prices, drop-off costs, and availability of choices in restaurants and shops. Each airport offers something the other doesn’t. This list comprises the world’s most economical, timely, and shopper-friendly airports.
Contents

The Best Airports in the World 2023
| The Best Airports in the World 2023 | |||||||||
| Rank | Airport | Country | Passenger Count | Average On Time Flights | Parking fees(usd) | Drop off cost(usd) | Restaurants | Shops | Final Score |
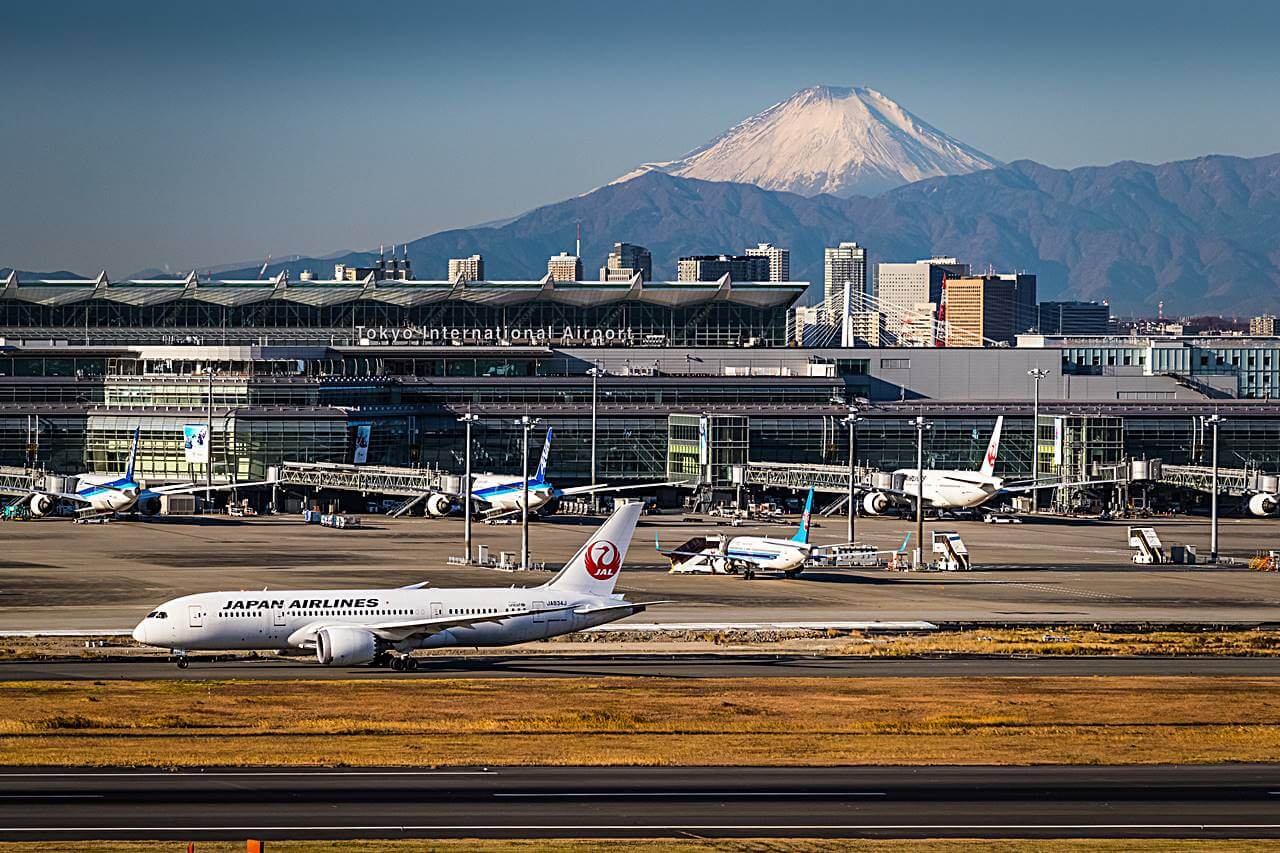
| 1 | Tokyo International (Haneda) Airport | Japan | 50,290,705 | 88.4 | 34.9 | 0 | 153 | 173 | 80 |
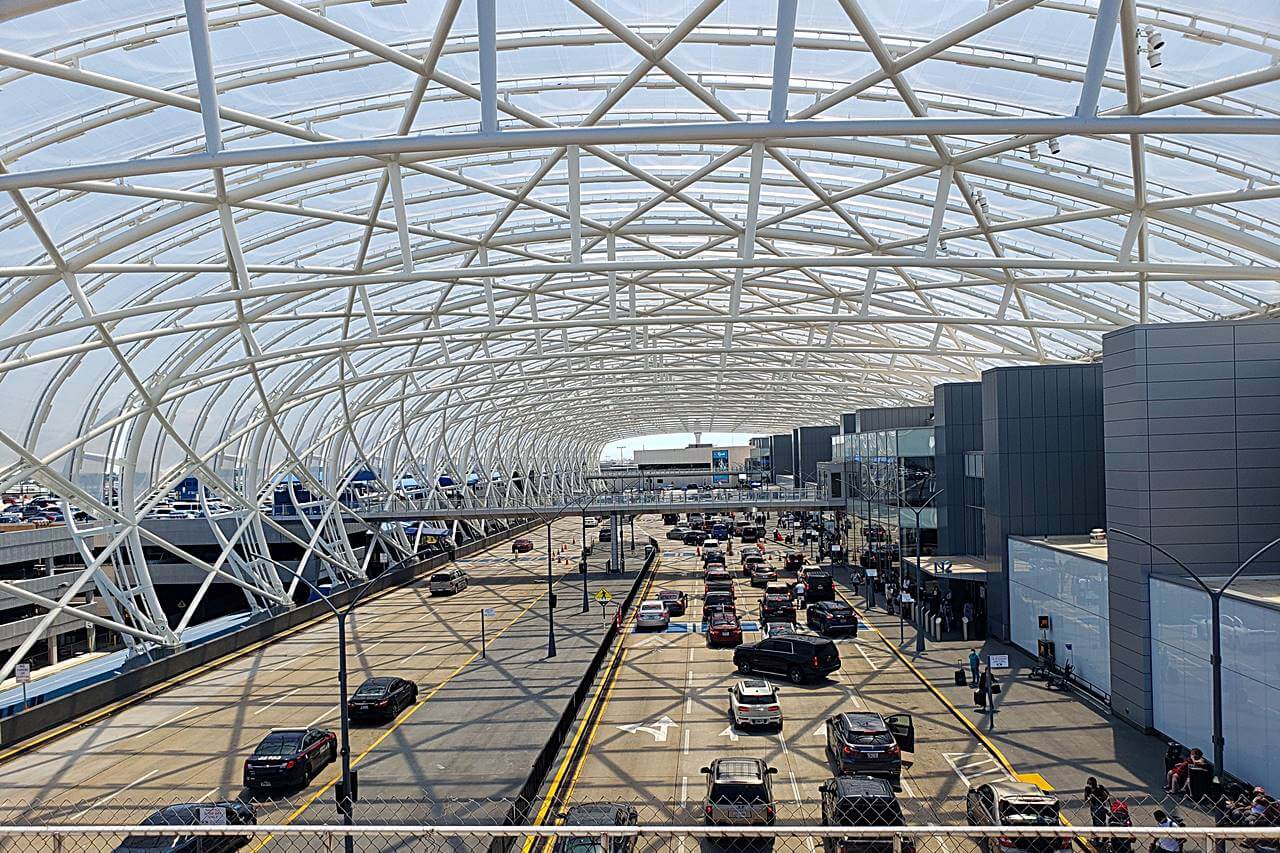
| 2 | Hartsfield-Jackson Atlanta International Airport | United States | 93,699,630 | 78.4 | 98 | 5 | 159 | 113 | 75.18 |
| 3 | O’Hare International Airport | United States | 68,340,619 | 77.2 | 56 | 0 | 116 | 60 | 71.04 |
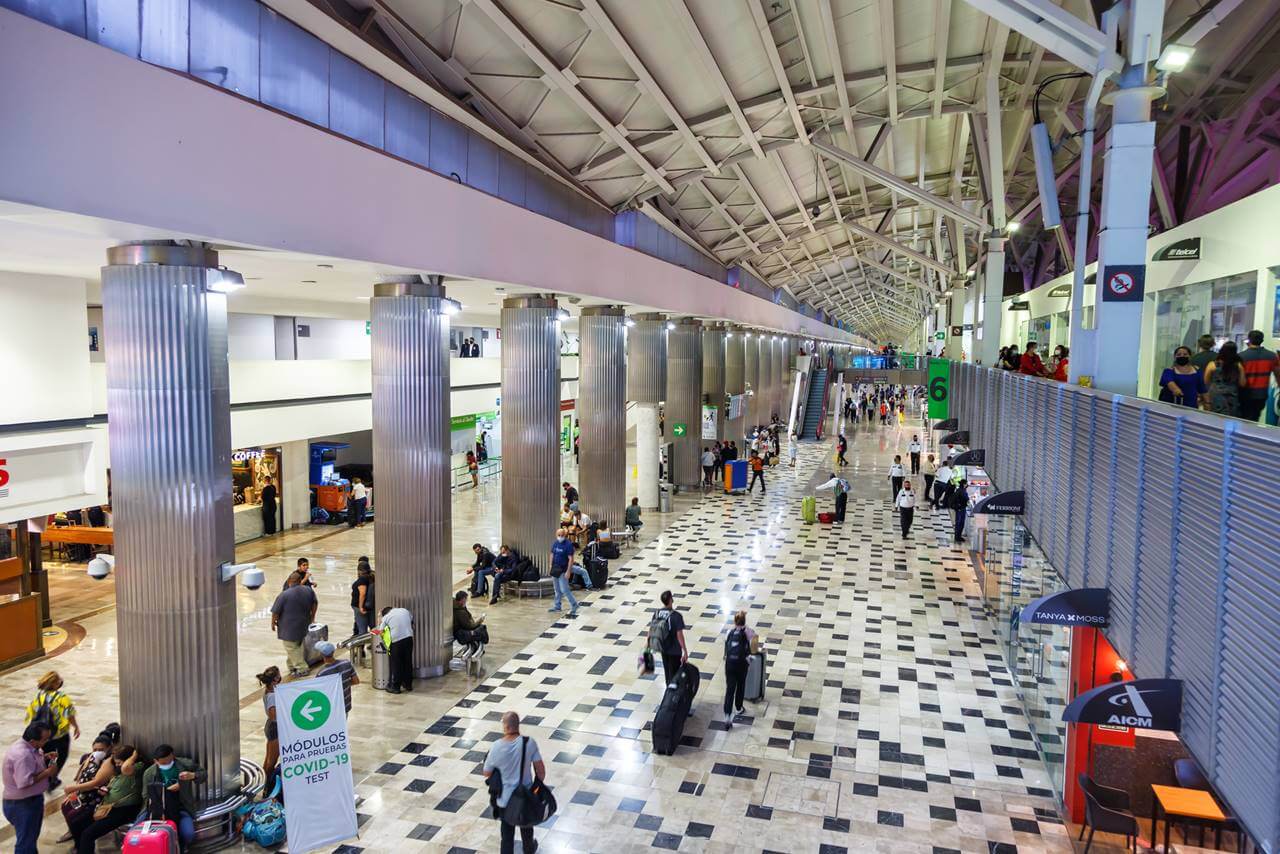
| 4 | Aeropuerto Internacional de la Ciudad de México “Lic Benito Juárez” | Mexico | 46,261,729 | 72 | 139.7 | 1.39 | 168 | 226 | 69.82 |
| 5 | Dallas/Ft Worth International Airport | United States | 73,362,946 | 75 | 105 | 2 | 99 | 92 | 67.59 |
| 6 | George Bush Intercontinental Airport | United States | 40,974,831 | 78.3 | 45.3 | 1 | 112 | 114 | 67.49 |
| 7 | Indira Gandhi International Airport | India | 59,490,074 | 81.1 | 51 | 1.22 | 54 | 84 | 67.23 |
| 8 | Denver International Airport | United States | 69,286,461 | 69.5 | 42 | 2 | 89 | 88 | 66.29 |
| 9 | Istanbul International Airport | Turkey | 64,289,107 | 75.2 | 16.2 | 2 | 36 | 91 | 65.67 |
| 10 | Charlotte Douglas International Airport | United States | 47,758,605 | 79.3 | 35 | 0 | 68 | 50 | 65.26 |
| 11 | Aeropuerto de Adolfo Suárez Madrid-Barajas | Spain | 50,602,864 | 82.6 | 48.6 | 0 | 32 | 66 | 65.19 |
| 12 | Miami International Airport | United States | 50,684,396 | 73.4 | 39 | 0 | 29 | 137 | 64.61 |
| 13 | Los Angeles International Airport | United States | 65,924,298 | 78.4 | 245 | 0 | 89 | 81 | 62.49 |
| 14 | San Francisco International Airport | United States | 42,210,201 | 79.6 | 54.5 | 2 | 62 | 59 | 61.6 |
| 15 | McCarran International Airport | United States | 52,694,312 | 70.3 | 112 | 1 | 73 | 114 | 61.41 |
| 16 | Orlando International Airport | United States | 50,176,103 | 69 | 76.4 | 0 | 78 | 73 | 61.31 |
| 17 | Soekarno-Hatta International Airport | Indonesia | 38,791,168 | 62 | 2.8 | 0 | 77 | 70 | 58.9 |
| 18 | Aeropuerto de Barcelona-El Prat | Spain | 41,616,302 | 76.8 | 71.2 | 0.06 | 36 | 33 | 58.74 |
| 19 | John F. Kennedy International Airport | United States | 55,287,711 | 69.4 | 232 | 4 | 139 | 121 | 58.05 |
| 20 | Sky Harbor International Airport | United States | 44,397,854 | 76.1 | 83 | 4 | 64 | 47 | 57.13 |
| 21 | Chhatrapati Shivaji International Airport | India | 38,332,106 | 80.7 | 85 | 1.22 | 21 | 20 | 56.59 |
| 22 | Logan International Airport | United States | 36,112,473 | 73.6 | 187 | 0 | 67 | 78 | 55.32 |
| 23 | Flughafen Frankfurt/Main | Germany | 48,918,482 | 53.3 | 85.3 | 0 | 60 | 113 | 54.72 |
| 24 | Amsterdam Airport Schiphol | Netherlands | 52,472,188 | 58.9 | 82 | 1.24 | 62 | 42 | 53.85 |
| 25 | Dubai International Airport | United Arab Emirates | 66,069,981 | 66.7 | 197.4 | 1.36 | 28 | 44 | 53.05 |
| 26 | Seattle-Tacoma International Airport | United States | 45,964,321 | 79.9 | 222 | 5 | 46 | 37 | 50.83 |
| 27 | Aéroport de Paris-Charles de Gaulle | France | 57,474,033 | 57.9 | 175 | 0 | 47 | 24 | 50.08 |
| 28 | Newark Liberty International Airport | United States | 43,565,254 | 67.4 | 287 | 4.25 | 128 | 73 | 49.58 |
| 29 | Toronto Pearson International Airport | Canada | 36,356,109 | 55.9 | 98.2 | 3.95 | 59 | 58 | 46.59 |
| 30 | Heathrow Airport | United Kingdom | 61,614,508 | 56.4 | 276.8 | 6.3 | 24 | 52 | 40 |
The final score considers the amount of average waiting time per passenger, the average amount of money spent for drop off and parking/passenger and the amount of choice they are privy to while in transit or before and after boarding.
On these specific parameters, Tokyo International (Haneda) Airport in Japan, Hartsfield-Jackson Atlanta International Airport, Hartsfield-Jackson Atlanta International Airport, O’Hare International Airport, Dallas/Ft Worth International Airport, George Bush Intercontinental Airport, Denver International Airport, Charlotte Douglas International Airport in United States and Aeropuerto Internacional de la Ciudad de México “Lic Benito Juárez” in Mexico, Indira Gandhi International Airport in India and Istanbul Airport in Turkey make up the top ten airports according to the scores mentioned above, and are positioned in the top-tier.
The ranking is not limited to enter source name’s score. If passengers want to opt for certain conveniences over others, they can always choose airports according to their unique strengths. What’s best for who can be further broken down into four more categories. If someone prioritizes flight timeliness over all, the Tokyo International (Haneda) Airport in Japan, Aeropuerto de Adolfo Suárez Madrid-Baraja in Spain, Indira Gandhi International Airport in India, Chhatrapati Shivaji International Airport in India, Seattle-Tacoma International Airport, San Francisco International Airport, Charlotte Douglas International Airport, Hartsfield-Jackson Atlanta International Airport, Los Angeles International Airport and George Bush Intercontinental Airport in the United States are the best choices.
The 10 Best Airports with Fewest Delays
| The 10 best airports with fewest delays | |||
| Rank | Airport | Country | Average OTP Flights (%) |
| 1 | Tokyo International (Haneda) Airport | Japan | 88.4 |
| 2 | Aeropuerto de Adolfo Suárez Madrid-Barajas | Spain | 82.6 |
| 3 | Indira Gandhi International Airport | India | 81.1 |
| 4 | Chhatrapati Shivaji International Airport | India | 80.7 |
| 5 | Seattle-Tacoma International Airport | United States | 79.9 |
| 6 | San Francisco International Airport | United States | 79.6 |
| 7 | Charlotte Douglas International Airport | United States | 79.3 |
| 8 | Hartsfield-Jackson Atlanta International Airport | United States | 78.4 |
| 9 | Los Angeles International Airport | United States | 78.4 |
| 10 | George Bush Intercontinental Airport | United States | 78.3 |
One major concern in airports is the crowdedness, this one is a Catch-22 situation, we cannot solely judge an airport on its crowdedness, because if people flock to airports that give them the best utility, however, overcrowdedness can pose a problem for travelers.
If the number of passengers crowding the airport is not a problem, Hartsfield-Jackson Atlanta, International Airport, Dallas/Ft Worth International Airport, Denver International Airport and O’Hare International Airport are amongst the top 10 airports in the world, while Dubai International Airport in the third-tier and 25th on the list, because of its comparative high drop off cost, low availability of restaurants and high flight delay time.

The 5 Busiest Airports in the World
| The 5 busiest airports in the world | |||
| Rank | Airport | Country | Passenger Count |
| 1 | Hartsfield-Jackson Atlanta International Airport | United States | 93,699,630 |
| 2 | Dallas/Ft Worth International Airport | United States | 73,362,946 |
| 3 | Denver International Airport | United States | 69,286,461 |
| 4 | O’Hare International Airport | United States | 68,340,619 |
| 5 | Dubai International Airport | United Arab Emirates | 66,069,981 |
And if you curate further, and prioritize a shopping and dining experience over anything else, Aeropuerto Internacional de la Ciudad de México “Lic Benito Juárez” in Mexico, Hartsfield-Jackson Atlanta International Airport in U.S.A, Tokyo International (Haneda) Airport in Japan, John F. Kennedy International Airport in United States and Newark Liberty International Airport in United States are the most suitable choices with passengers with a sweet tooth and a liking for that good living!
The 5 Best Airports With the Most Restaurant Choices
| The 5 best airports with the most restaurant choices | |||
| Rank | Airport | Country | Restaurants |
| 1 | Aeropuerto Internacional de la Ciudad de México “Lic Benito Juárez” | Mexico | 168 |
| 2 | Hartsfield-Jackson Atlanta International Airport | United States | 159 |
| 3 | Tokyo International (Haneda) Airport | Japan | 153 |
| 4 | John F. Kennedy International Airport | United States | 139 |
| 5 | Newark Liberty International Airport | United States | 128 |

The 5 Best Airports with Cheapest Parkings
And for regular passengers who drive to and forth from the airport frequently, the best options are as follows:
| The 5 best airports with cheapest parkings | |||
| Rank | Airport | Country | Parking fees weekly(usd) |
| 1 | Soekarno-Hatta International Airport | Indonesia | 2.8 |
| 2 | Istanbul International Airport | Turkey | 16.2 |
| 3 | Tokyo International (Haneda) Airport | Japan | 34.9 |
| 4 | Charlotte Douglas International Airport | United States | 35 |
| 5 | Miami International Airport | United States | 39 |
So, the next time you pack your bags, choose according to your convenience or from Enter source list to have the smoothest flying experience catered to your personal needs. So, fly away, ladies and gentlemen! Happy traveling!
Methodology
Our study thoroughly examined 30 of the busiest international airports in the world according to the Port Authority of New York & New Jersey’s 2022 Annual Airport Traffic Report.
Each airport was then analyzed on the following factors, giving each airport a normalized score of 100. Once the scores were normalized, we calculated each airport’s overall performance. To achieve this, we combined the individual scores, considering their weights assigned based on importance.
By applying appropriate weights to the normalized scores, we created a composite score for each state. The final composite score, ranging from 40 to 80 (to give a more realistic view for the readers), reflects a statistically meaningful assessment of the airport’s overall performance.
The individual scores for each feature are not stored in the final dataset but just the actual values.
The criteria are as of below.
- Total passenger count
According to the Port Authority of New York & New Jersey, the total number of passengers passed through the airports. - Average on-time performance
Airport On-time performance is based on the actual departure gate times within 15 minutes of schedule. According to The Official Aviation Guide of the Airways (OAG) we took each airport’s monthly average on-time flight percentage. - Parking Fees
The latest cost of a week’s parking according to the airport’s own website, using the cheapest option available (such as a long-stay car park, economy parking etc – if available). - Drop off cost
The cost to drop someone off outside the terminal building, according to the airport’s own website). Here, the cost of the shortest available parking slot has been taken for each airport. - Restaurant Count
According to the airport’s website, the number of restaurants and bars in the airport’s terminal buildings. - Shop Count
According to the airport’s website, the number of duty-free shops in the airport’s terminal buildings.
Methodology: Further Details
- The actual scores are padded to 40-80 for more realistic-looking scores.
- Weights for each feature are as below and are taken to be a bit more subjective:
| Feature | Weight | |
| 1 | Total passenger count | 1 |
| 2 | Average on-time performance | 1.25 |
| 3 | Parking Fees | -1 |
| 4 | Drop off cost | -0.5 |
| 5 | Restaurant Count | 0.75 |
| 6 | Shop Count | 0.75 |